What is the Phillips Curve?
The Phillips curve shows the inverse relationship between the inflation rate and the unemployment rate. Any attempt by the government to reduce the unemployment rate will cause a rise in the inflation rate. On the other hand, reducing the inflation rate will lead to a rise in the unemployment rate. In a nutshell, there is a conflict between the objective of controlling inflation and reducing the unemployment rate.
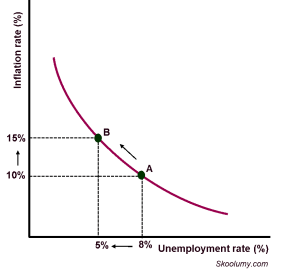
The government can reduce the tax rate or increase government spending (expansionary fiscal policy) to lower the unemployment rate. But this will come at a cost- a rising inflation rate. A lower tax rate, for example, will increase consumption and investment, which in turn raises aggregate demand. A higher aggregate demand can fuel inflation. In Figure 1 below, a fall in the unemployment rate from 8% to 5% causes a rise in the inflation rate from 10% to 15%.
Figure 1: The Phillips Curve
A rise in tax rate or reduction in government spending (contractionary fiscal policy) reduces aggregate demand and curbs demand-pull inflation. However, the falling consumption and investment result in a drop in the number of jobs available, thereby raising the unemployment rate.
Criticisms of the Phillips Curve
It is not applicable in the long run
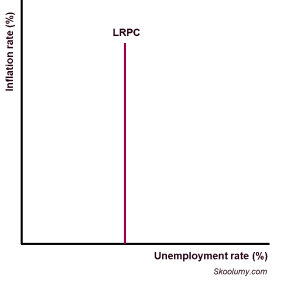
The normal Phillips curve is short-term in nature. This means that there is no long-term inverse relationship between the inflation rate and the unemployment rate. The long-run Phillips curve is vertical, as any change in the inflation rate does not affect unemployment. In the long run, the economy is operating at full capacity, and the unemployment rate experienced is the natural rate of unemployment. Therefore, inflation rate or government policy has no effect on the unemployment rate in the long run.
Figure 2: Long-run Phillips Curve
Stagflation
Stagflation is from two words, namely “Stagnation” and “Inflation”. It refers to a situation where there is no/slow economic growth and the inflation rate is high at the same time. The unemployment rate may be rising, and the inflation rate is rising at the same time. Thus, there is a positive relationship between inflation and unemployment, thereby invalidating the traditional Phillips curve theory.
Economists criticised the Phillips curve theory in the 1970s because many countries experienced high inflation and a high unemployment rate at the same time.
Inflation expectation
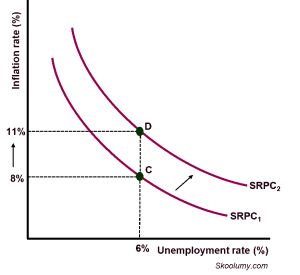
If the inflation rate is expected to rise, workers will ask for higher wages to boost their purchasing power. Businesses will also raise their prices to cover their costs and maintain their profit margins if they expect the inflation rate to increase. This is not usually accompanied by job cuts. Therefore, these actions will raise the inflation rate without reducing the unemployment rate. If a higher inflation rate is expected, the short-run Phillips Curve (SRPC) shifts upward from SRPC1 to SRPC2 (Figure 3 below). The inflation rate rises from 8% to 11% while the unemployment rate is unchanged at 6%.
Figure 3: The effect of expectation on the Phillips Curve
Expectations-Augmented Phillips Curve
Two US economits, Friedman Milton and Edmund Phelps, incorporated inflation expectations in the Phillips curve, and developed the expectations-augmented Phillips curve. It is based on the fact that a fall in the unemployment rate will not arise as the inflation rate increases in the long run.
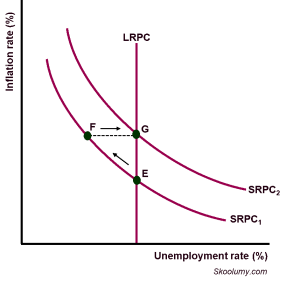
The expectations-augmented Phillips curve explains why the long-run Phillips curve is a vertical line. When aggregate demand increases, businesses expand their output, employ more people, thereby reducing unemployment. However, the inflation rate increases (from point E to F in Figure 4 below). Because the actual inflation rate has risen, people expect the future inflation rate to rise; this encourages workers to ask for higher wages. Higher wages increase the cost of production, thereby causing firms to reduce output. Consequently, some jobs are lost and the unemployment rate rises and returns to the previous level, the natural rate of unemployment (from point F to G in Figure 4 below).
Figure 4: Expectations-Augmented Phillips Curve
.