Movement along the short-run aggregate supply curve
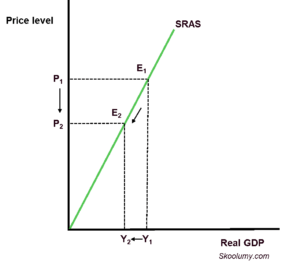
A movement along the aggregate supply curve is caused by a change in the price level while all other factors affecting aggregate supply remain constant. An increase in the price level will lead to an extension of the aggregate supply or an increase in aggregate supply quantity (Figure 1 below), while a decrease in the price level will lead to a contraction of aggregate supply or a decrease in aggregate supply quantity (Figure 2 below).
Figure 1: Extension of short-run aggregate supply
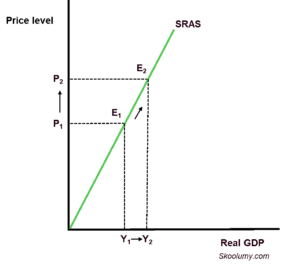
Figure 2: Contraction of short-run aggregate supply
Shift in the short-run aggregate supply curve
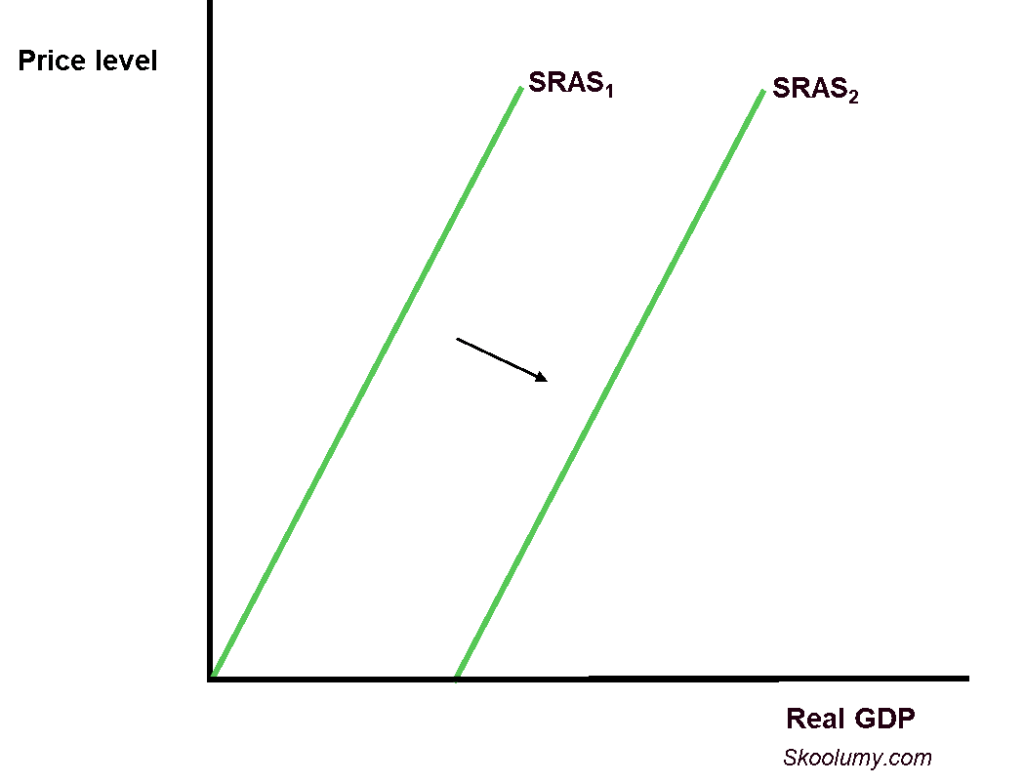
The SRAS curve can shift because of changes in costs. If the factors that are kept constant in the short run change, the aggregate supply curve will shift, e.g., wage rate, raw material costs, taxation, etc. If raw material cost increases, the SRAS will decrease and the SRAS curve will shift to the left (Figure 3 below). A fall in the corporate tax rate will increase SRAS and shift the SRAS curve to the right (Figure 4 below).
Figure 3: Decrease in short-run aggregate supply
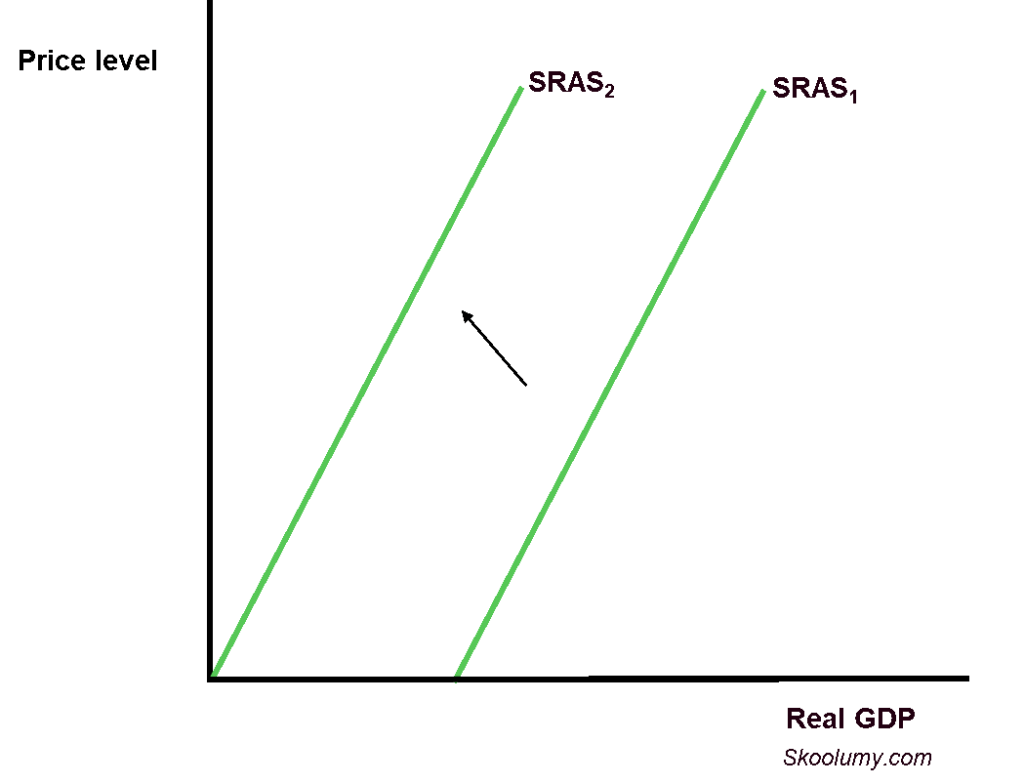
Figure 4: Increase in short-run aggregate supply
Long-run aggregate supply curve(LRAS)
The long-run aggregate supply (LRAS) curve represents the level of output an economy can produce when all factors of production are variable. In the long run, output is determined by the economy’s productive capacity, not by the price level. LRAS is the total supply in an economy when prices of inputs are not constant. Changes in the prices of factors of production have been adjusted in the long run. There are two types of LRAS curves, namely Classical LRAS and Keynesian LRAS.
Classical long-run aggregate supply curve
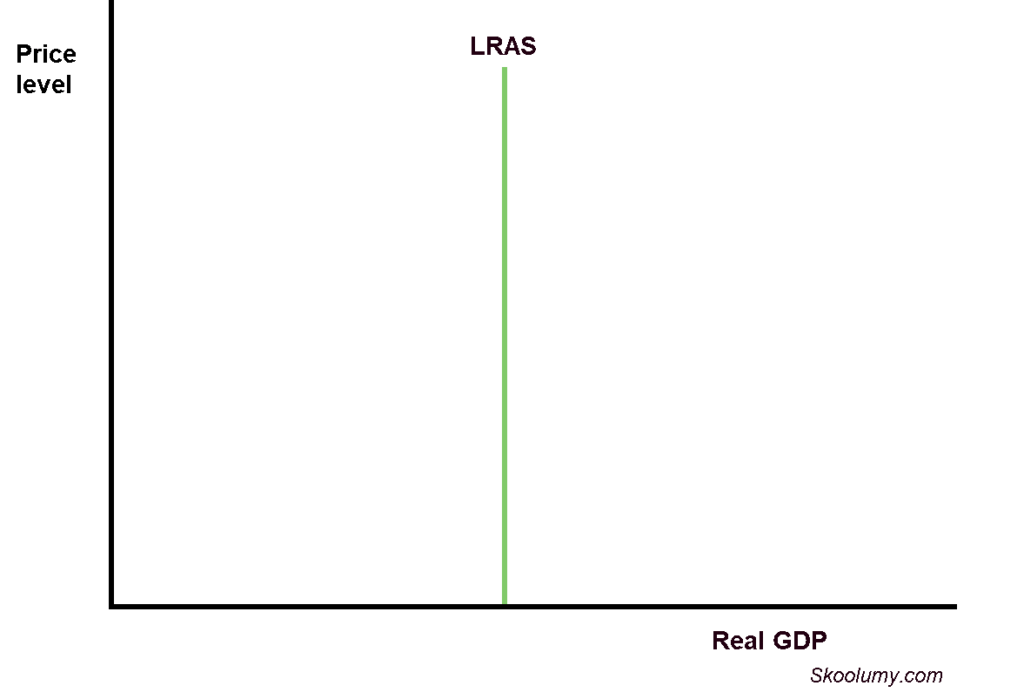
The Classical LRAS curve is a vertical line because the classical economists are of the belief that in the long run, all resources are fully used and the output is maximised (Figure 5 below). Changes in the price level do not affect real GDP in the long run; instead, they only lead to inflation or deflation.
Figure 5: Classical long-run aggregate supply curve
Keynesian long-run aggregate supply curve
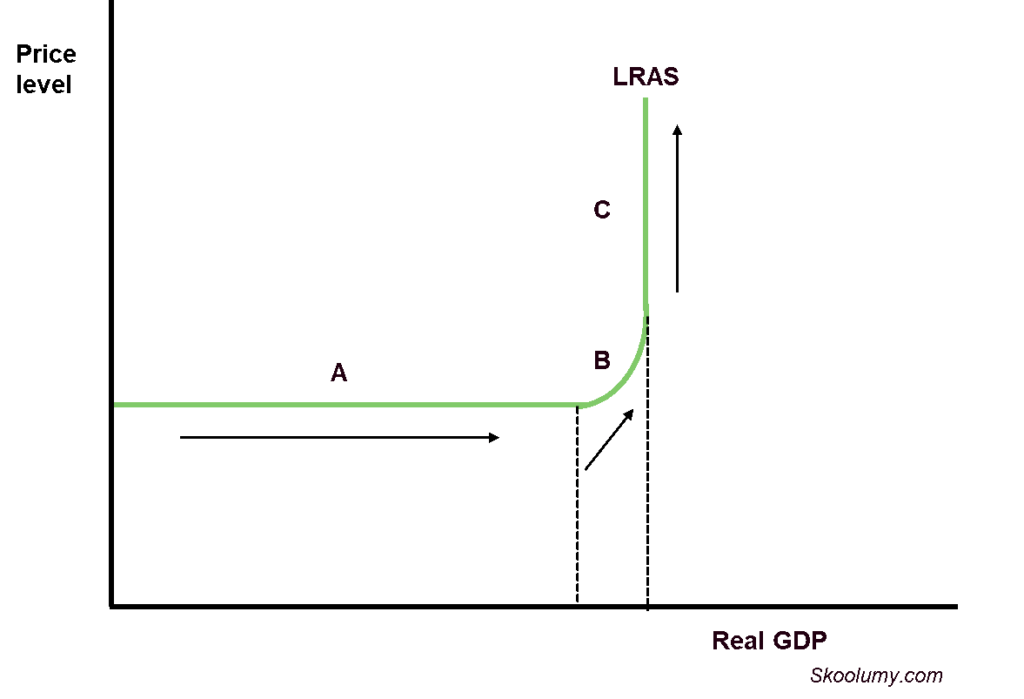
The Keynesian LRAS curve has three parts (Figure 6 below). It is perfectly elastic first (line A), that is horizontal; then it slopes upward (line B), and finally, it becomes a vertical line (line C). Initially, not all resources are used; their prices do not increase so the price level remains unchanged (line A). As output increases, more resources are needed; the increased demand for resources pushes their prices up, thereby leading to a rise in the price level (line B); the final stage is when all resources are fully employed and total output is fixed (line C).
Figure 6: Keynesian long-run aggregate supply curve
Shift in the long-run aggregate supply curve
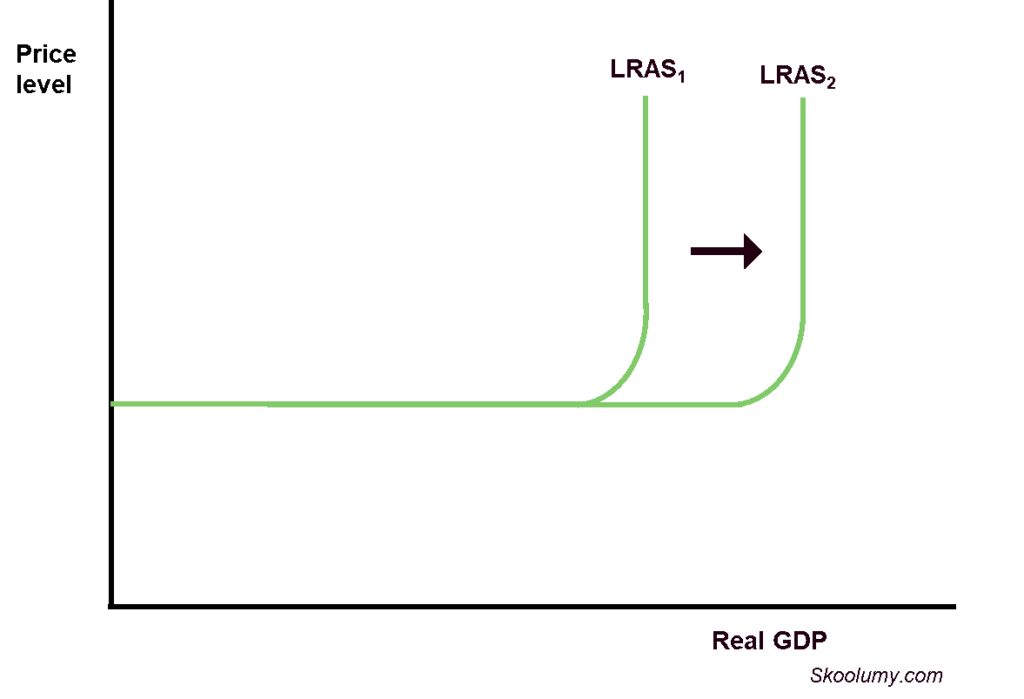
The LRAS curve shows what the economy can produce if all resources are fully used. So, a shift in the LRAS curve occurs when the quantity and quality of factors of production change. An increase in the labour force as a result of net immigration or an increase in retirement age will increase the amount of resource (labour) available and shift the LRAS curve to the right (Figures 7 and 8 below). Technological advancement can increase the quality of machines by making them more productive/efficient, thereby causing a rightward shift in the LRAS curve. Note that these two factors (quantity and quality of resources) also have the capacity to shift the aggregate supply curve in the short run.
Figure 7: Shift in the Classical LRAS Curve
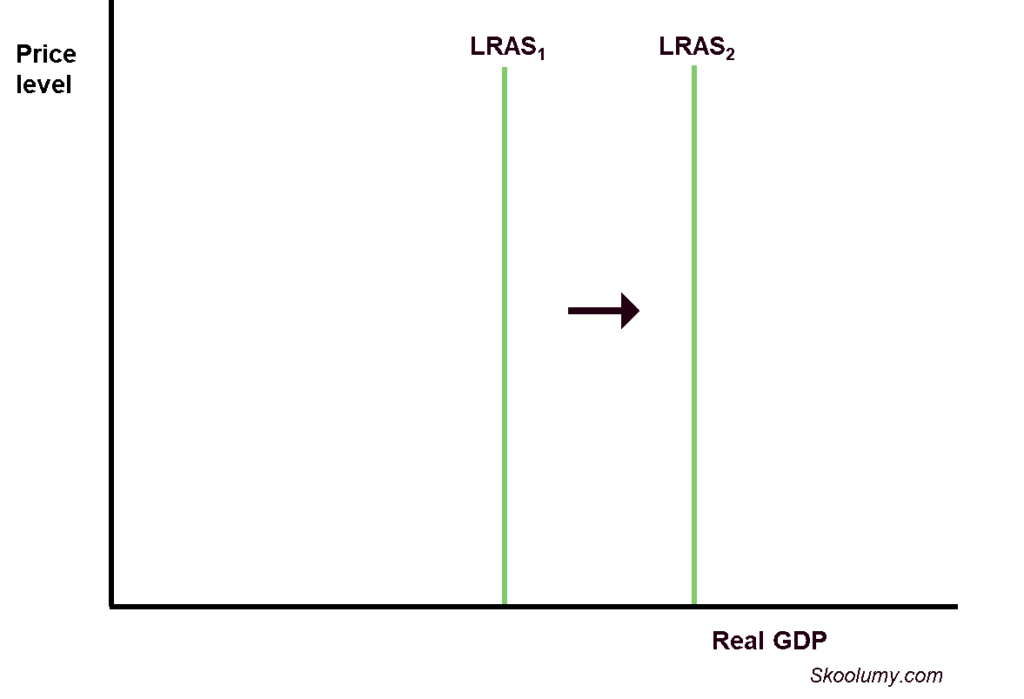
Figure 8: Shift in the Keynesian LRAS Curve